Allow college students to check how crowded dining halls and libraries are before they go
Organization / Cornell Design & Tech Initiative
Role / Designer working with two other designers, two product managers, and six developers
Tools / Sketch, Abstract, Zeplin
Timeline / 6 months
Flux is a mobile app that allows college students to check how crowded campus facilities are before they go. It is currently available on iOS and Android.
Problem
College students want to check how crowded campus facilities are, so that they can save time.
First things first - the Flux team wanted to test whether this was an actual problem that students faced. Thus, we used the Wizard of Oz MVP approach.
We built out a quick webpage, as shown below. Behind the scenes, we had a team member literally sitting at the location, counting how many spots were open, and manually updating the webpage in real time.

In the course of two to three days, we had 800 users visit the page. This validated our assumption that there was interest in knowing how crowded a specific spot was on campus. We took this as a signal to move forward with the project.
Team
And thus, an 11-person team was formed. We consisted of two product managers, three designers, and six developers.

How do we collect our data?
Our first problem was to figure out how to collect data.
In our initial discussions, we considered buying sensors, and placing them in areas across campus. However, after some preliminary research, we found that this would be a very costly option - definitely not in the budget of an undergrad project team.
Now, we knew we had to provide some sort of initial data for users. Thus, each team member physically went to the facilities and manually recorded the density every twenty minutes. Now, we at least had data - something to show our users.
But the problem with this was it didn't scale. Thus, the real game changer, was when we started talking to facility managers at gyms, dining halls and libraries. We found that they actually kept real-time records of density levels throughout the day.
Low-fidelity wireframes
Once we found out we would be able to work with the facility managers, we began the design work. We started with low-fidelity wireframes.

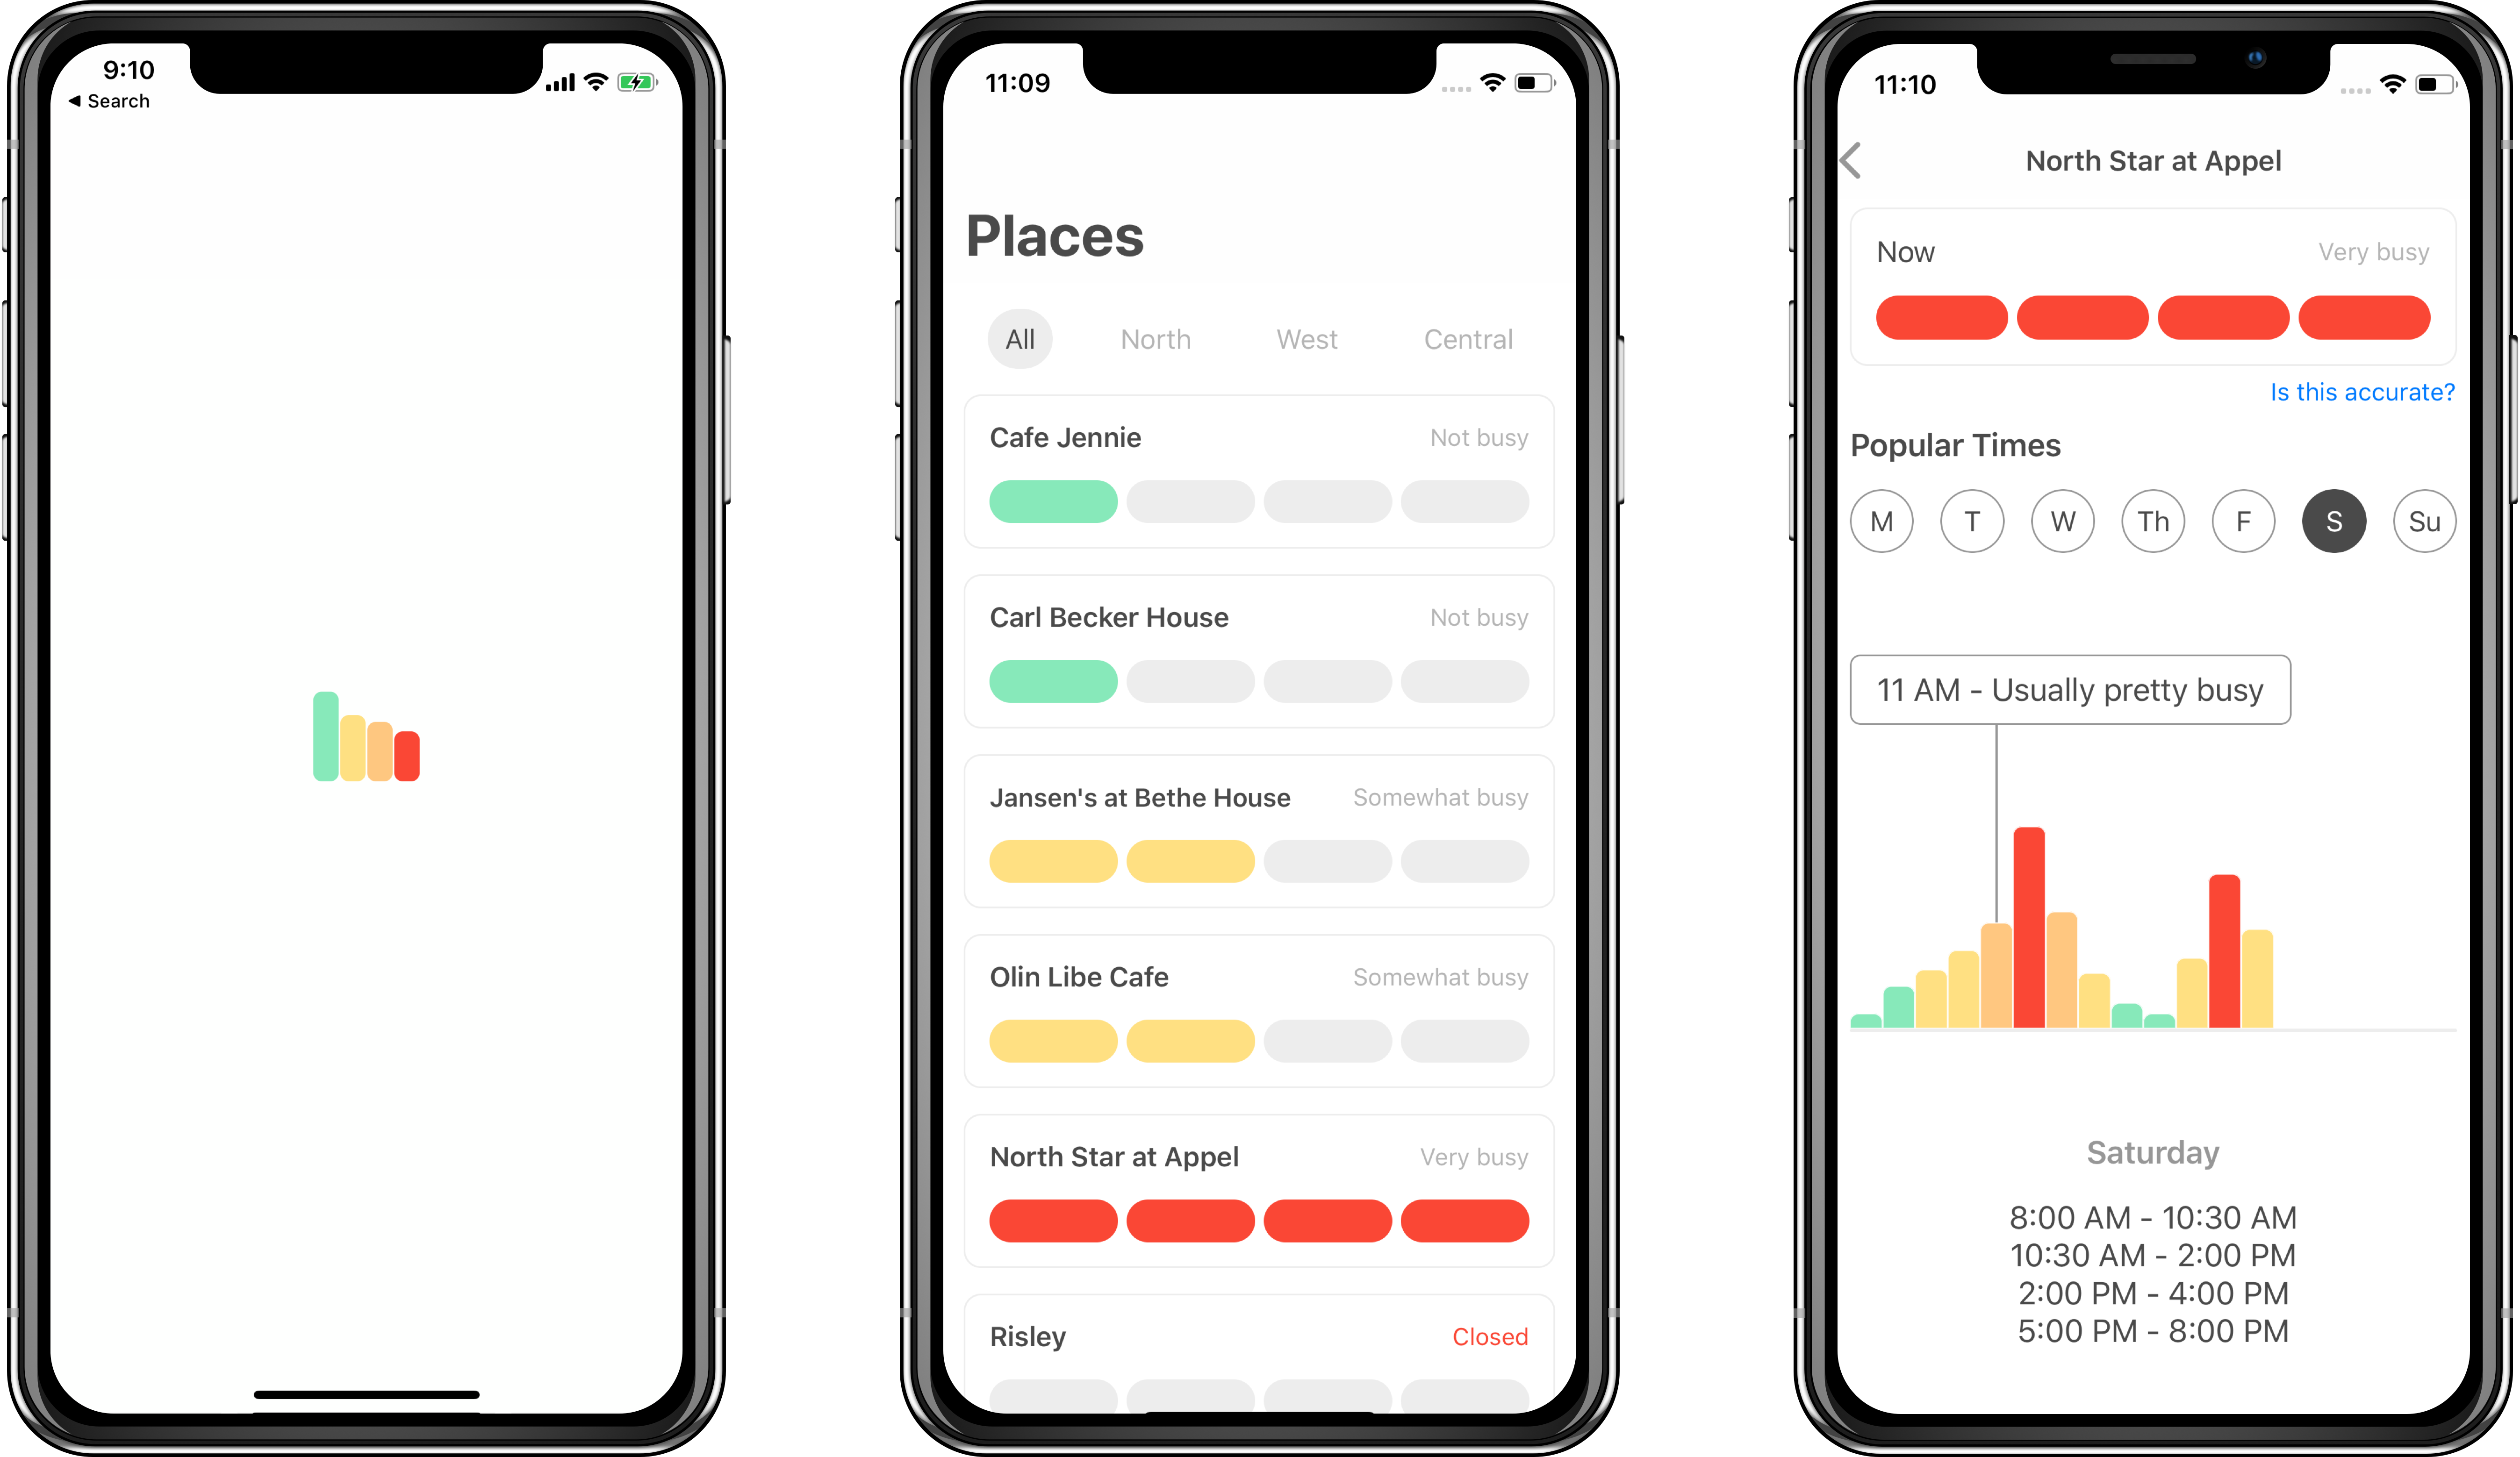
Final design
After collaborating with our developers, we were able to realize our designs in production.
We launched!


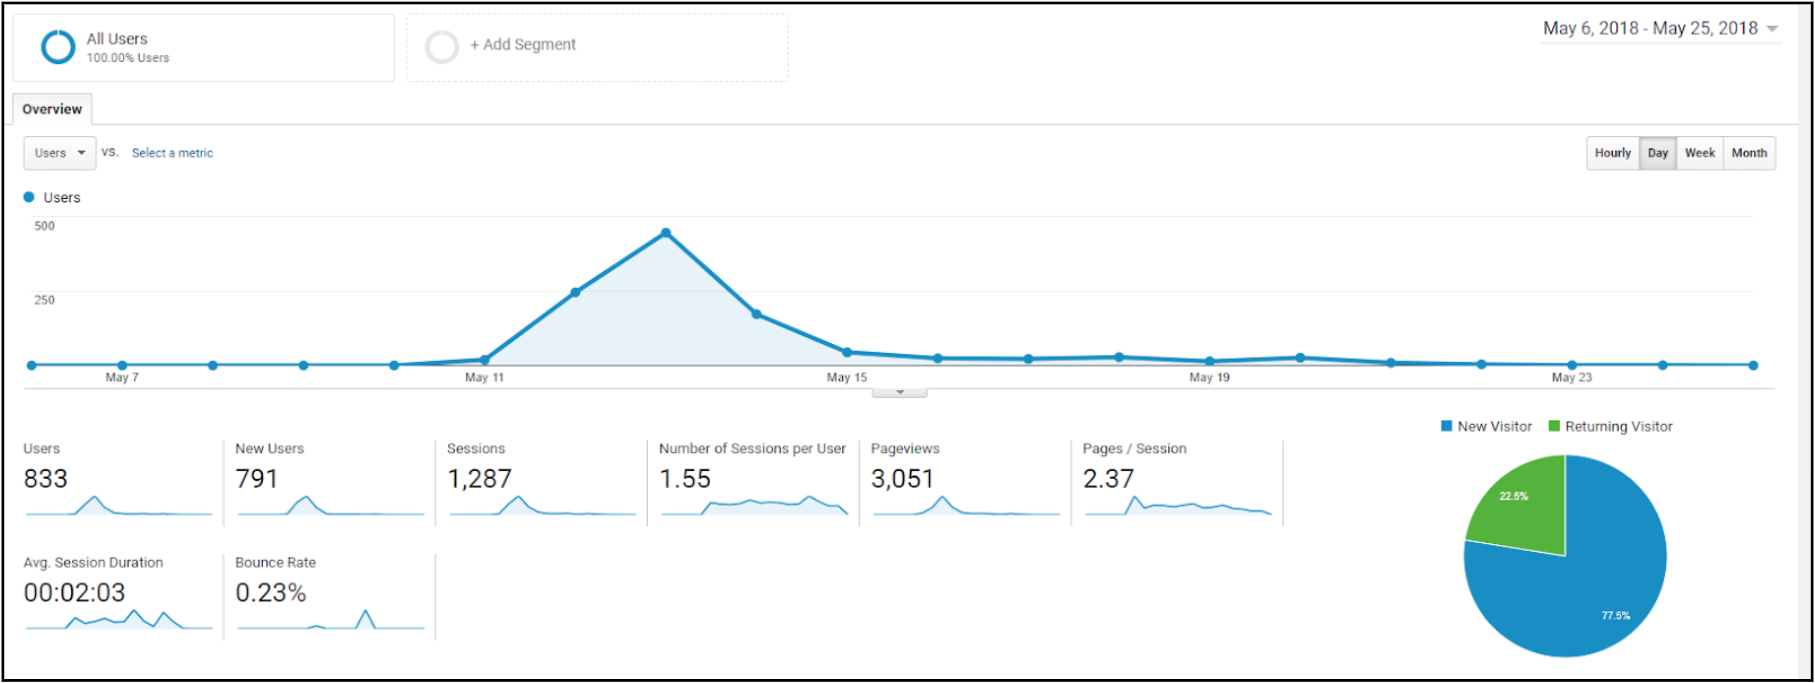
Post-launch analytics
After launch, we were able to get 729 users in the first month.
Next steps
1. Crowdsource our data.
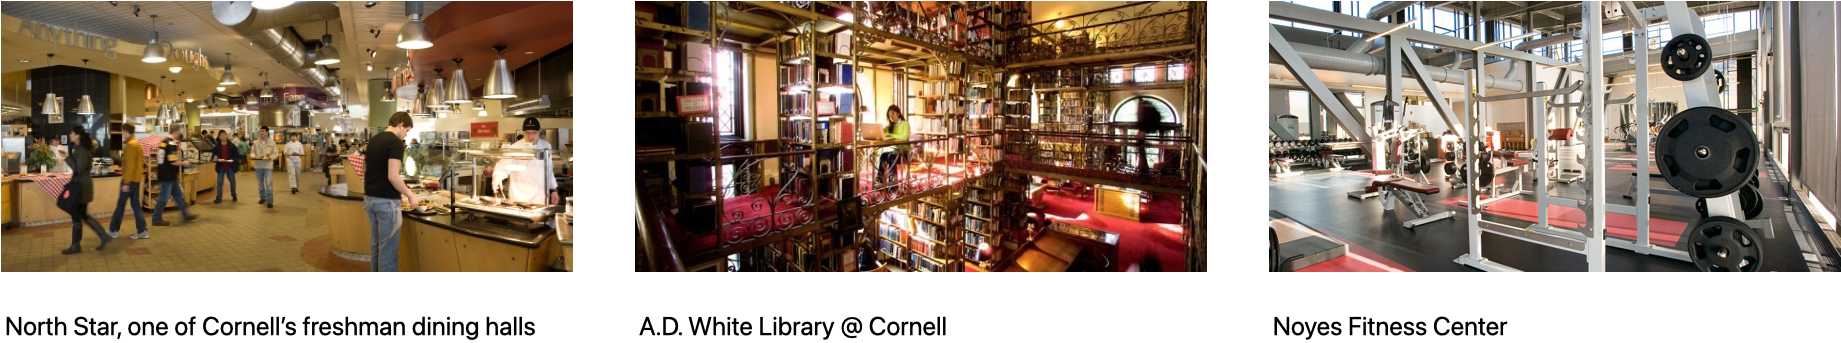
2. Expand to libraries and gyms, on top of dining halls.
3. Expand to other schools.

Personal Takeaway
There are so many creative ways to work around technical constraints.